Partner API · Levi's Stadium pilot

Know the shade
before the sale.

Seat-level comfort intelligence, delivered by API.

Chasing Shade scores every section of a stadium for shade, temperature, UV, and time-to-burn — at any game time, for any event. Ticketing partners embed the score into seat selection, turning a hidden health variable into a reason to buy.

How it works

Five factors. One score.
Every section.

The score blends what a person actually feels in a seat — computed from astronomy, stadium geometry, and live weather. Every factor is returned in the response; the weights are tunable per venue.

Where the sun is

NOAA-grade solar

Sun azimuth and elevation for any seat, date, and time — validated against NOAA's reference solar calculator to better than 0.01°. No external feed; pure astronomy.

How much shade

Two honest signals

Ray-sampled overhead cover plus far-rim blocking when the sun is low across the field. Reports shaded (out of direct sun) separately from covered (protected from rain) — the same honest split major seat-rating sites use.

What you feel

A transparent score

Apparent temperature, UV, humidity, and wind blend with shade into a 0–100 comfort score. The per-factor breakdown and the exact weights ship in every response — no black box.

Time-to-Burn by Fitzpatrick skin type (I–VI): at the same UV, Type I burns several times faster than Type VI; after sunset, no burn risk. A guidance figure for a comfort tool — not a medical claim.
Beyond the 7-day window, the score draws from years of weather history at the venue — labeled "historical" so it's never confused with a live forecast.
Partner integration

Comfort as a lens,
not a destination.

The overlay lives inside your existing seat-selection step — a toggle in your map's control bar that tints the seats you already render, comfort chips in your listing cards, detail in your existing seat panel. Off by default; one tap on. Your funnel, your brand, our science.

Drop-in widget

A themeable web component with presets — add one tag and a little config. Best for resellers and fast pilots.

Headless / data-only

Consume the API directly and build in your own components. Best for partners with mature design systems.

<comfort-overlay venue-id="levis" event-date="2026-09-13" event-time="13:00" theme="marketplace" attribution="compact"> </comfort-overlay>
The market

Pull wherever buyers choose among comparable seats.

When a buyer is picking among listings for the same event, "which of these is in the shade at 1pm in August?" is a direct conversion lever. Comfort becomes UX differentiation where partners compete on experience, not exclusive inventory.

Leading with
Secondary-market resellers

Compete purely on UX and value; the comfort score is an immediate, per-listing conversion lever. Fast pilots, live embeds.

API-first bridge platforms

Straddle primary and secondary; UX differentiation is a competitive weapon and integration is straightforward.

Scale opportunity
Primary ticketing platforms

Own the seat map and the venue relationship; a live reference makes the case for rollout across every venue.

The scale column reflects platform types where comfort intelligence has a natural fit. It does not imply any existing partnership or integration agreement.

The honest story

Demo-grade where it's
demo-grade — on purpose.

NOAA-grade accuracy

Sun position matches NOAA's reference solar calculator to better than 0.01° — more than ten times tighter than the contractual bar.

Transparent formula

Every response includes the score, the per-factor breakdown, and the exact weights used. Weights are venue settings — recalibrated without a code change.

PII-free by design

No names, no emails, no personal data. The subscription feed is keyed by opaque tokens — venue, event, seat only. A natural fit for partner privacy and compliance.

Honest about the horizon

Inside 7 days: live forecast. Beyond: historical probability, always labeled. The system never pretends to know what it can't.

The current pilot is ~85% geometry fidelity — comfort is computed per zone (deck × compass sector) and mapped onto sections, not a bespoke per-seat reading for every seat in the bowl. The path to full per-section fidelity is identified and scoped. The demo earns trust by being honest about its own limits. Full methodology in the API docs →
See it live

The comfort heatmap, live.

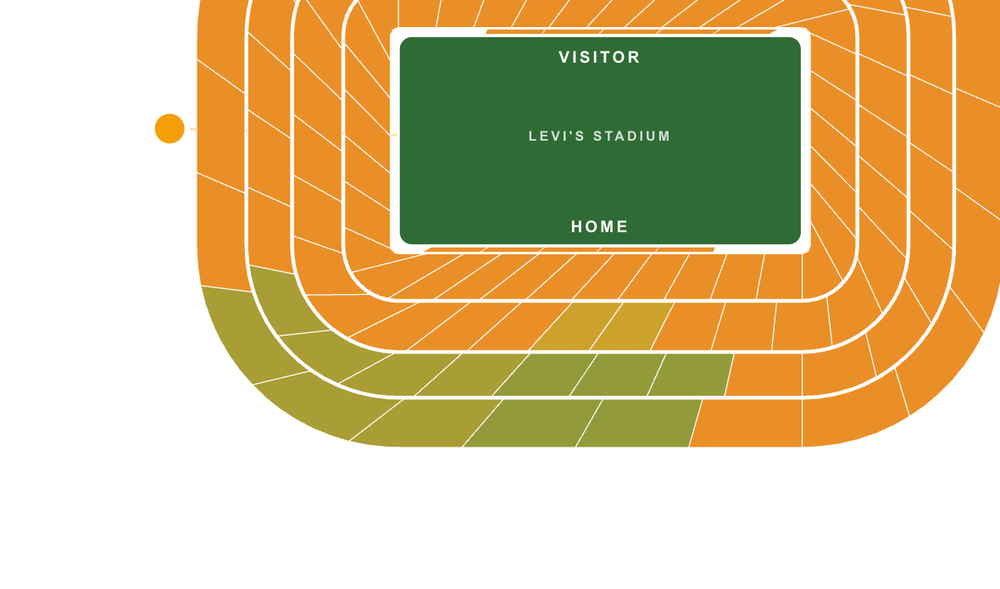
Levi's Stadium comfort heatmap — sun-exposed sections in orange, shaded sections in green

Levi's Stadium. Real sections. Real comfort scores from the live API. Scrub through game day, switch skin types, hover any section for the full breakdown — shade, temperature, UV, and time-to-burn.